
It’s no surprise, Mortgage Brokers in North America have become one of the most competitive businesses in Search Engine Marketing (SEM). Many mortgage brokers prefer to target locally, as people don’t like to travel far to find their financial assistance. With major banks on every street corner, it’s important to make a presence to those within your immediate area. This of course causes mortgage brokers to compete quite heavily over smaller geographic regions as banks and other mortgage brokers are battling for the same territory.
Search Engine Marketing has become the new front teir. For SEM, Google Ads is the preferred platform for these companies to do search ads – the ones that appear at the top of search results. Using Google Ads, virtually anyone has the ability to pay for top positions on Google’s search results page.
Mortgage Brokers are unique in that only a small percentage have adopted online marketing into their budget. Those that are can see immediate cost-effective results, and competition is growing fast. This indicates there is likely tremendous return on investment, and still an opportunity for a competitive advantage over those who have not turned to online marketing strategies yet.
Through AdLuge, we have been able to use industry average data to help mortgage brokers understand what should be expected out of paid search campaigns.
Search Engine Marketing isn’t slowing down. Being Google’s largest source of revenue, it can be anticipated that more focus will be placed on this service year over year. It’s success and continued growth is attributed to demonstrated results and return on investment for millions of Google Ads campaigns each month.
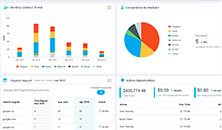
The below data represents averages for nearly 20 mortgage brokers that currently use the AdLuge Marketing Intelligence tool.
Google Ads Industry Averages
The following article outlines the average Google Ads paid search metrics from October, 2013. This data has been compared to paid search account data from July, four months earlier.
Although many variables can affect each campaign, this information is valuable in helping the your industry evaluate the performance of Google Ads campaigns. Comparing your performance to competitors and others within your industry can help determine whether there is need for improvement in your strategy.
Campaign Spend
The average mortgage broker spent $1,217 in October. This is down from $1,561 in July. The difference in ad spend may just be seasonality, however as you will see within this article, the average cost per conversion actually went up. Typically budgets increase with competition, along with the cost per conversion. In this case spend went down. This also may be due to increased competition, if your competitors are outbidding you on the same key terms you are targeting. If they outbid you, your ad wont get served, and your budget won’t be spent.
Clicks
The average Google Ads campaign got 221 clicks in October, down from 284 in July. It is important to note that many Mortgage Brokers measured through AdLuge tracking have a very targeted search marketing strategy. Location and service areas are the basis of the targeting strategy, so there is often only a limited amount of clicks that can be gathered. The average Cost Per Click (CPC) remain generally unchanged, marginally increasing from $5.49 to $5.50. This is surprising, as you will see, July performed much better at a cost-per-conversion level, get their cost per clicks are virtually identical. Typically, If there is less competition on the bid, you will pay less per click. Here we see little change.
Conversions
The average Google Ads search campaign garnered an average 6 form submissions or phone leads during the month of October, not surprisingly down from an average of 8.5 in July. Based on budgets, this means the average Cost-Per-Lead (CPL) was around $197 per lead. In July, the average mortgage broker saw a CPL of $183. Incredible value is being seen within this industry, regardless of the month.
Figuring out the long-term monetary value of a customer will help determine an acceptable CPL threshold.
Impression Share
Impression Share refers to the percentage at which your ads are being served up compared to others targeting the same audience. The average impression share for all campaigns was an average of 41 in October. Lower impression share is sometimes a result of budget restrictions, however it is easy to see that compared to July with an average impression share of 44%, mortgage brokers are likely spending more than what our AdLuge industry averages are telling us. Strong competition is often a factor in impression share, as they are competing for the same target audience, and same ad space. Whenever possible, we recommend to do your best to maximize impression share without compromising your Cost-Per-Conversion. This may require some trial and error over a few months.
What Should Your Next Steps Be?
Next month I will be writing an article on average lead trends for mortgage brokers across several online mediums. This will help to understand some of the latest tips that other competitors are employing in order to achieve better conversion performance across all efforts.

Hey guys – looks like the table overlaps with the sidebar here.